Overview
The Monetise alliance at TrustedHousesitters objective was to increase Average Revenue User (ARPU). To help achieve this we undertook a redesign of the pricing page. The redesign was the first iteration towards achieving this goal. We aimed to optimise the page to encourage an increase in overall conversion rate and as well as a shift to more users selecting premium.
Goals
- Increase customers choosing the premium tier
- Increase average revenue per user (ARPU)
- Increase conversion rate
Team members
- Product Manager
- Data analyst
- Full-stack engineers
Process
Data analysis
Collaborating with data analysts I analysed user behaviour on the pricing page, identifying pain points and opportunities. We observed that very few users were actually clicking on the links to learn about each feature. We hypothesised that if we entice users to explore each feature, they would be more likely to choose the premium tier.
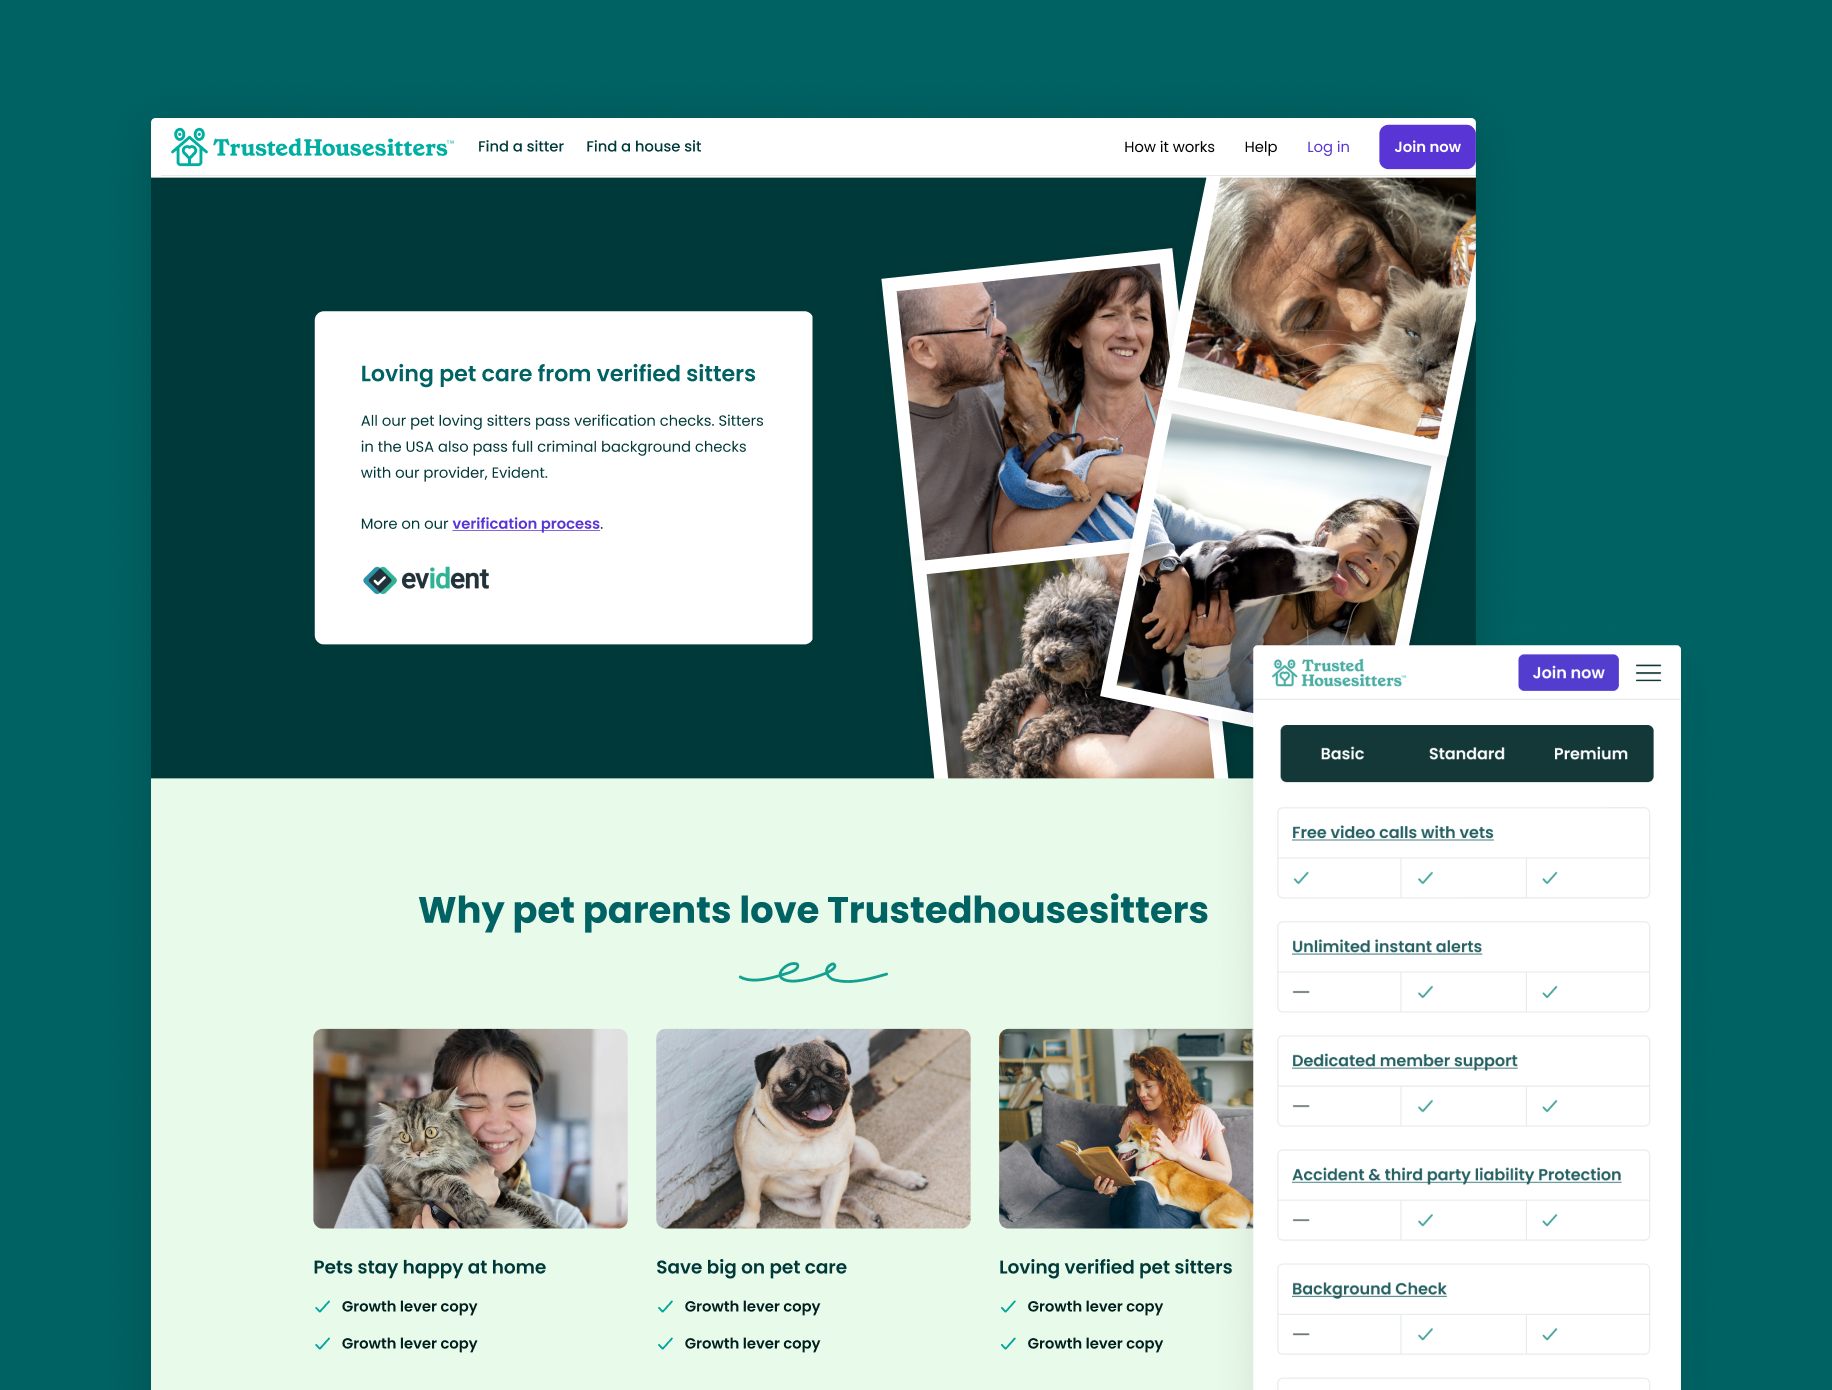
Data also helped us prioritise how we would plan the test. HotJar showed us that on the existing pricing page, only around 10% of users scrolled past the main pricing tiers, which led us to the decision to only test the redesigned pricing tiers and not the supporting content below in the first iteration.
Competitor review
I reviewed many pricing pages to observe best practices and design patterns on industry leading SaaS pricing pages.
Ideation and redesign
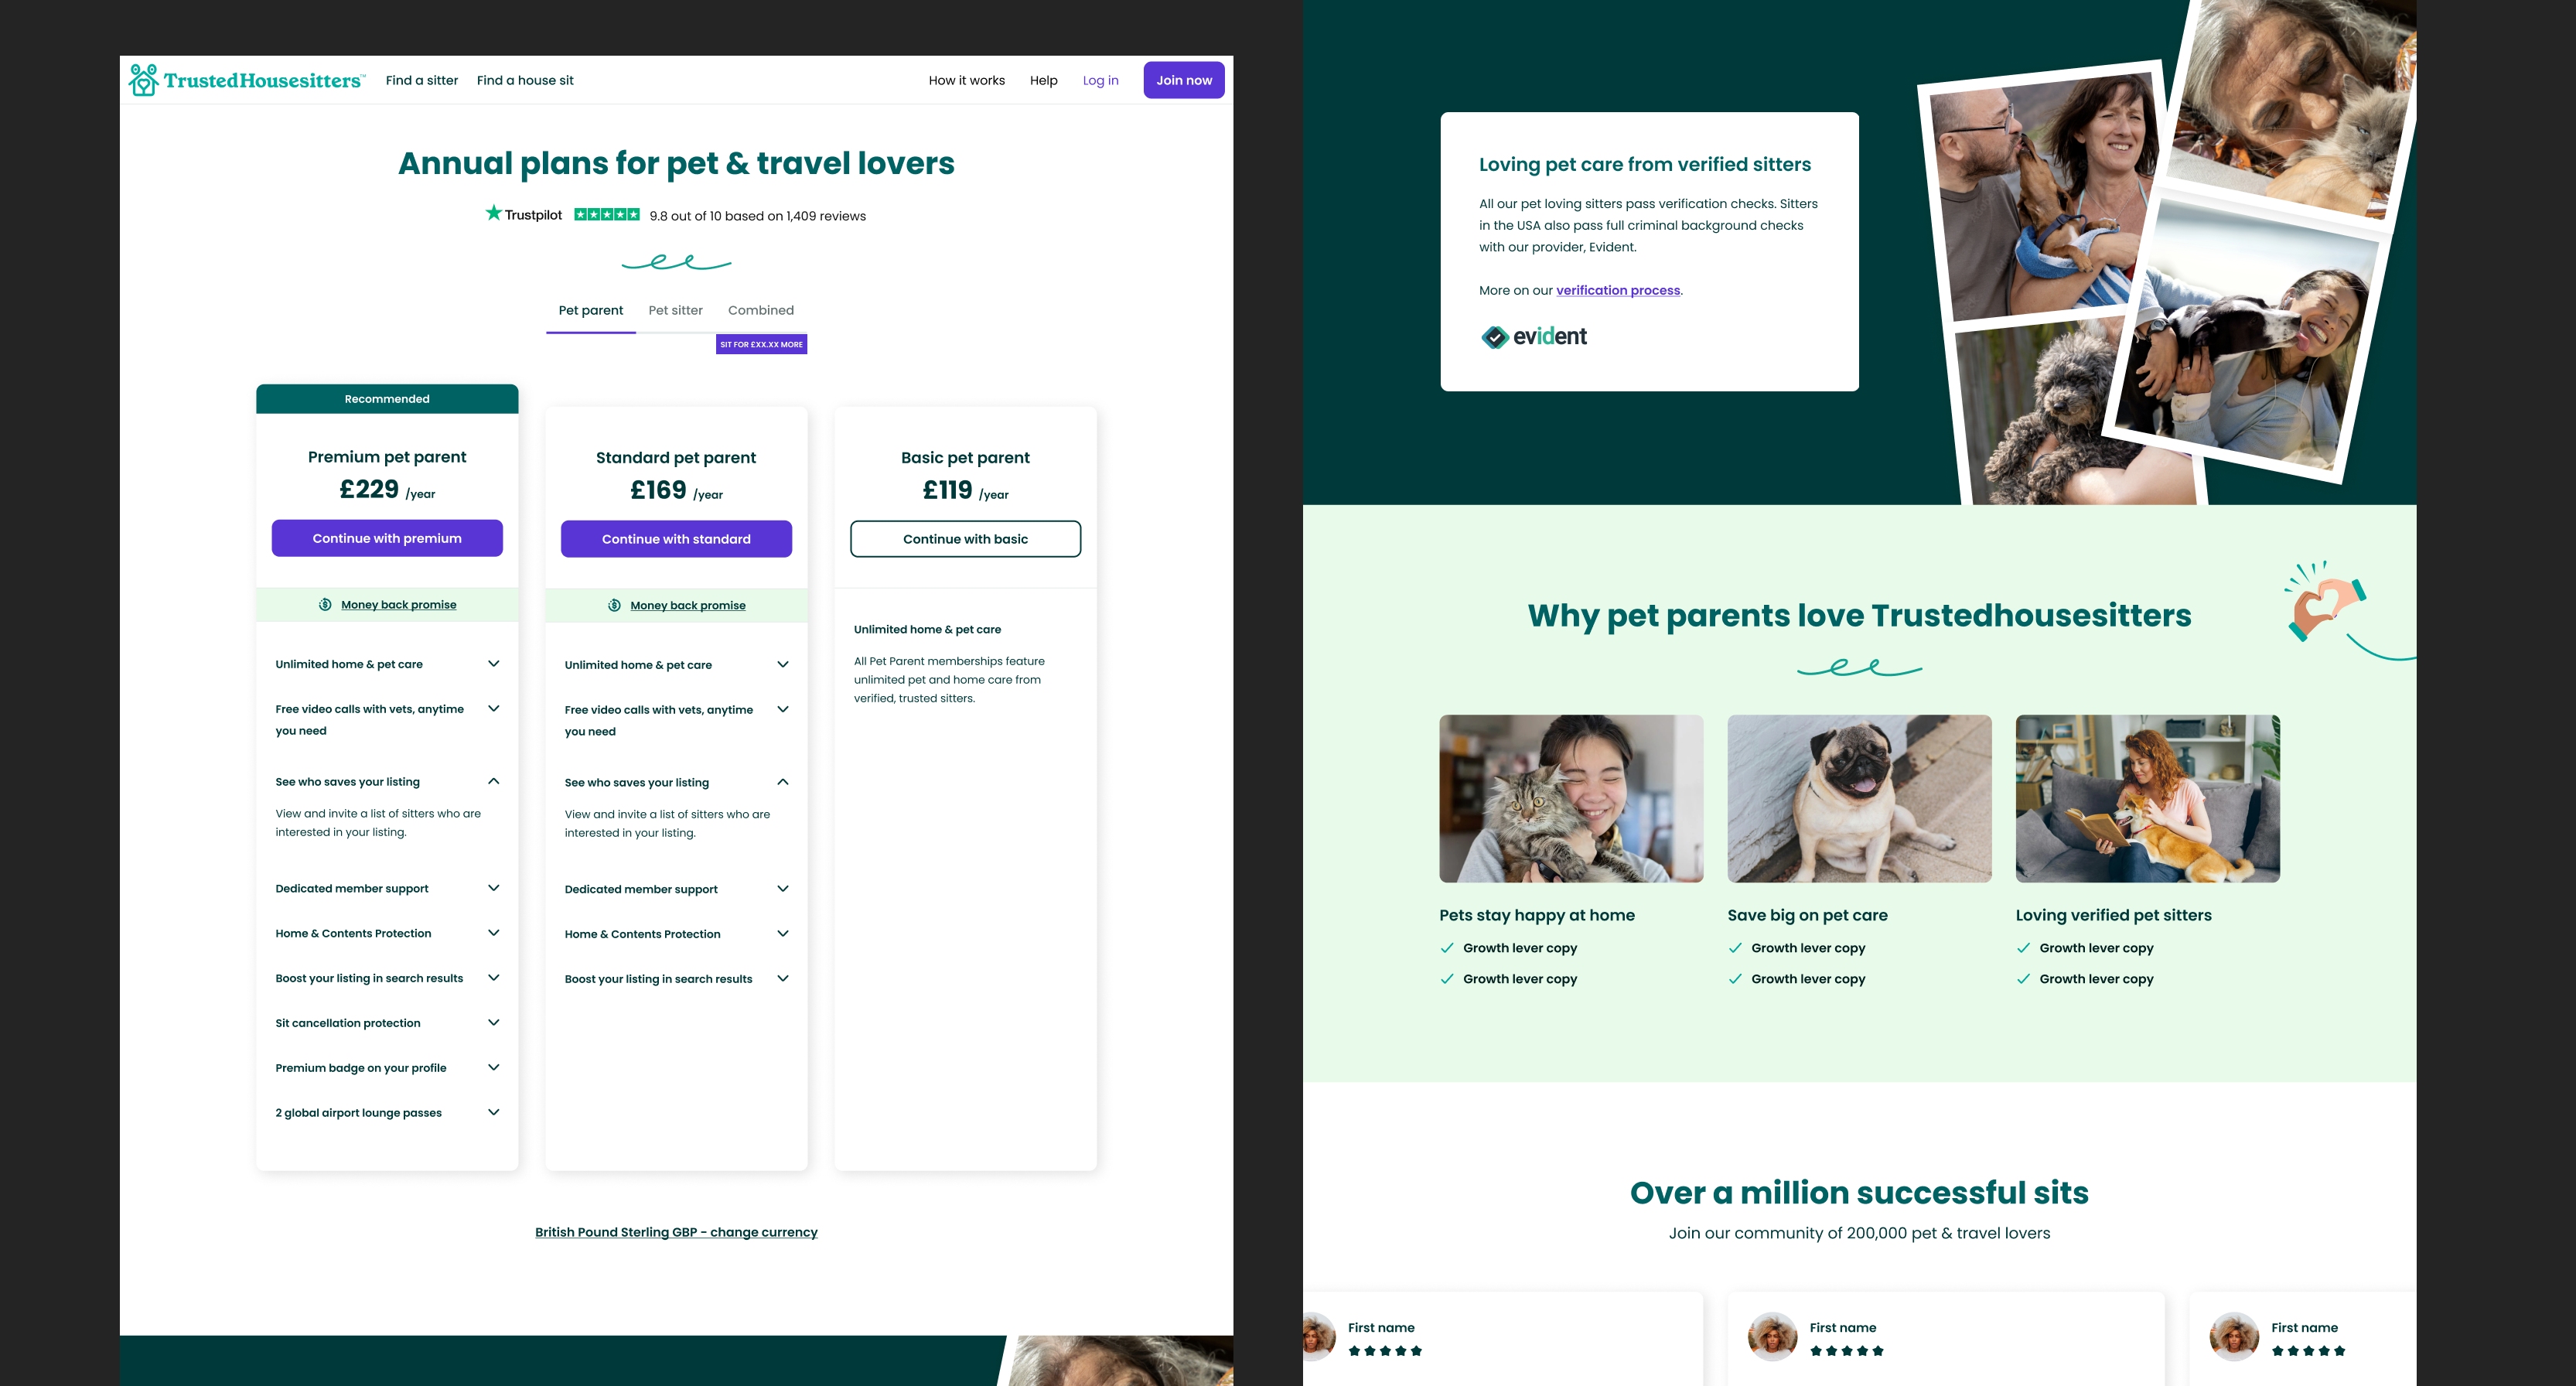
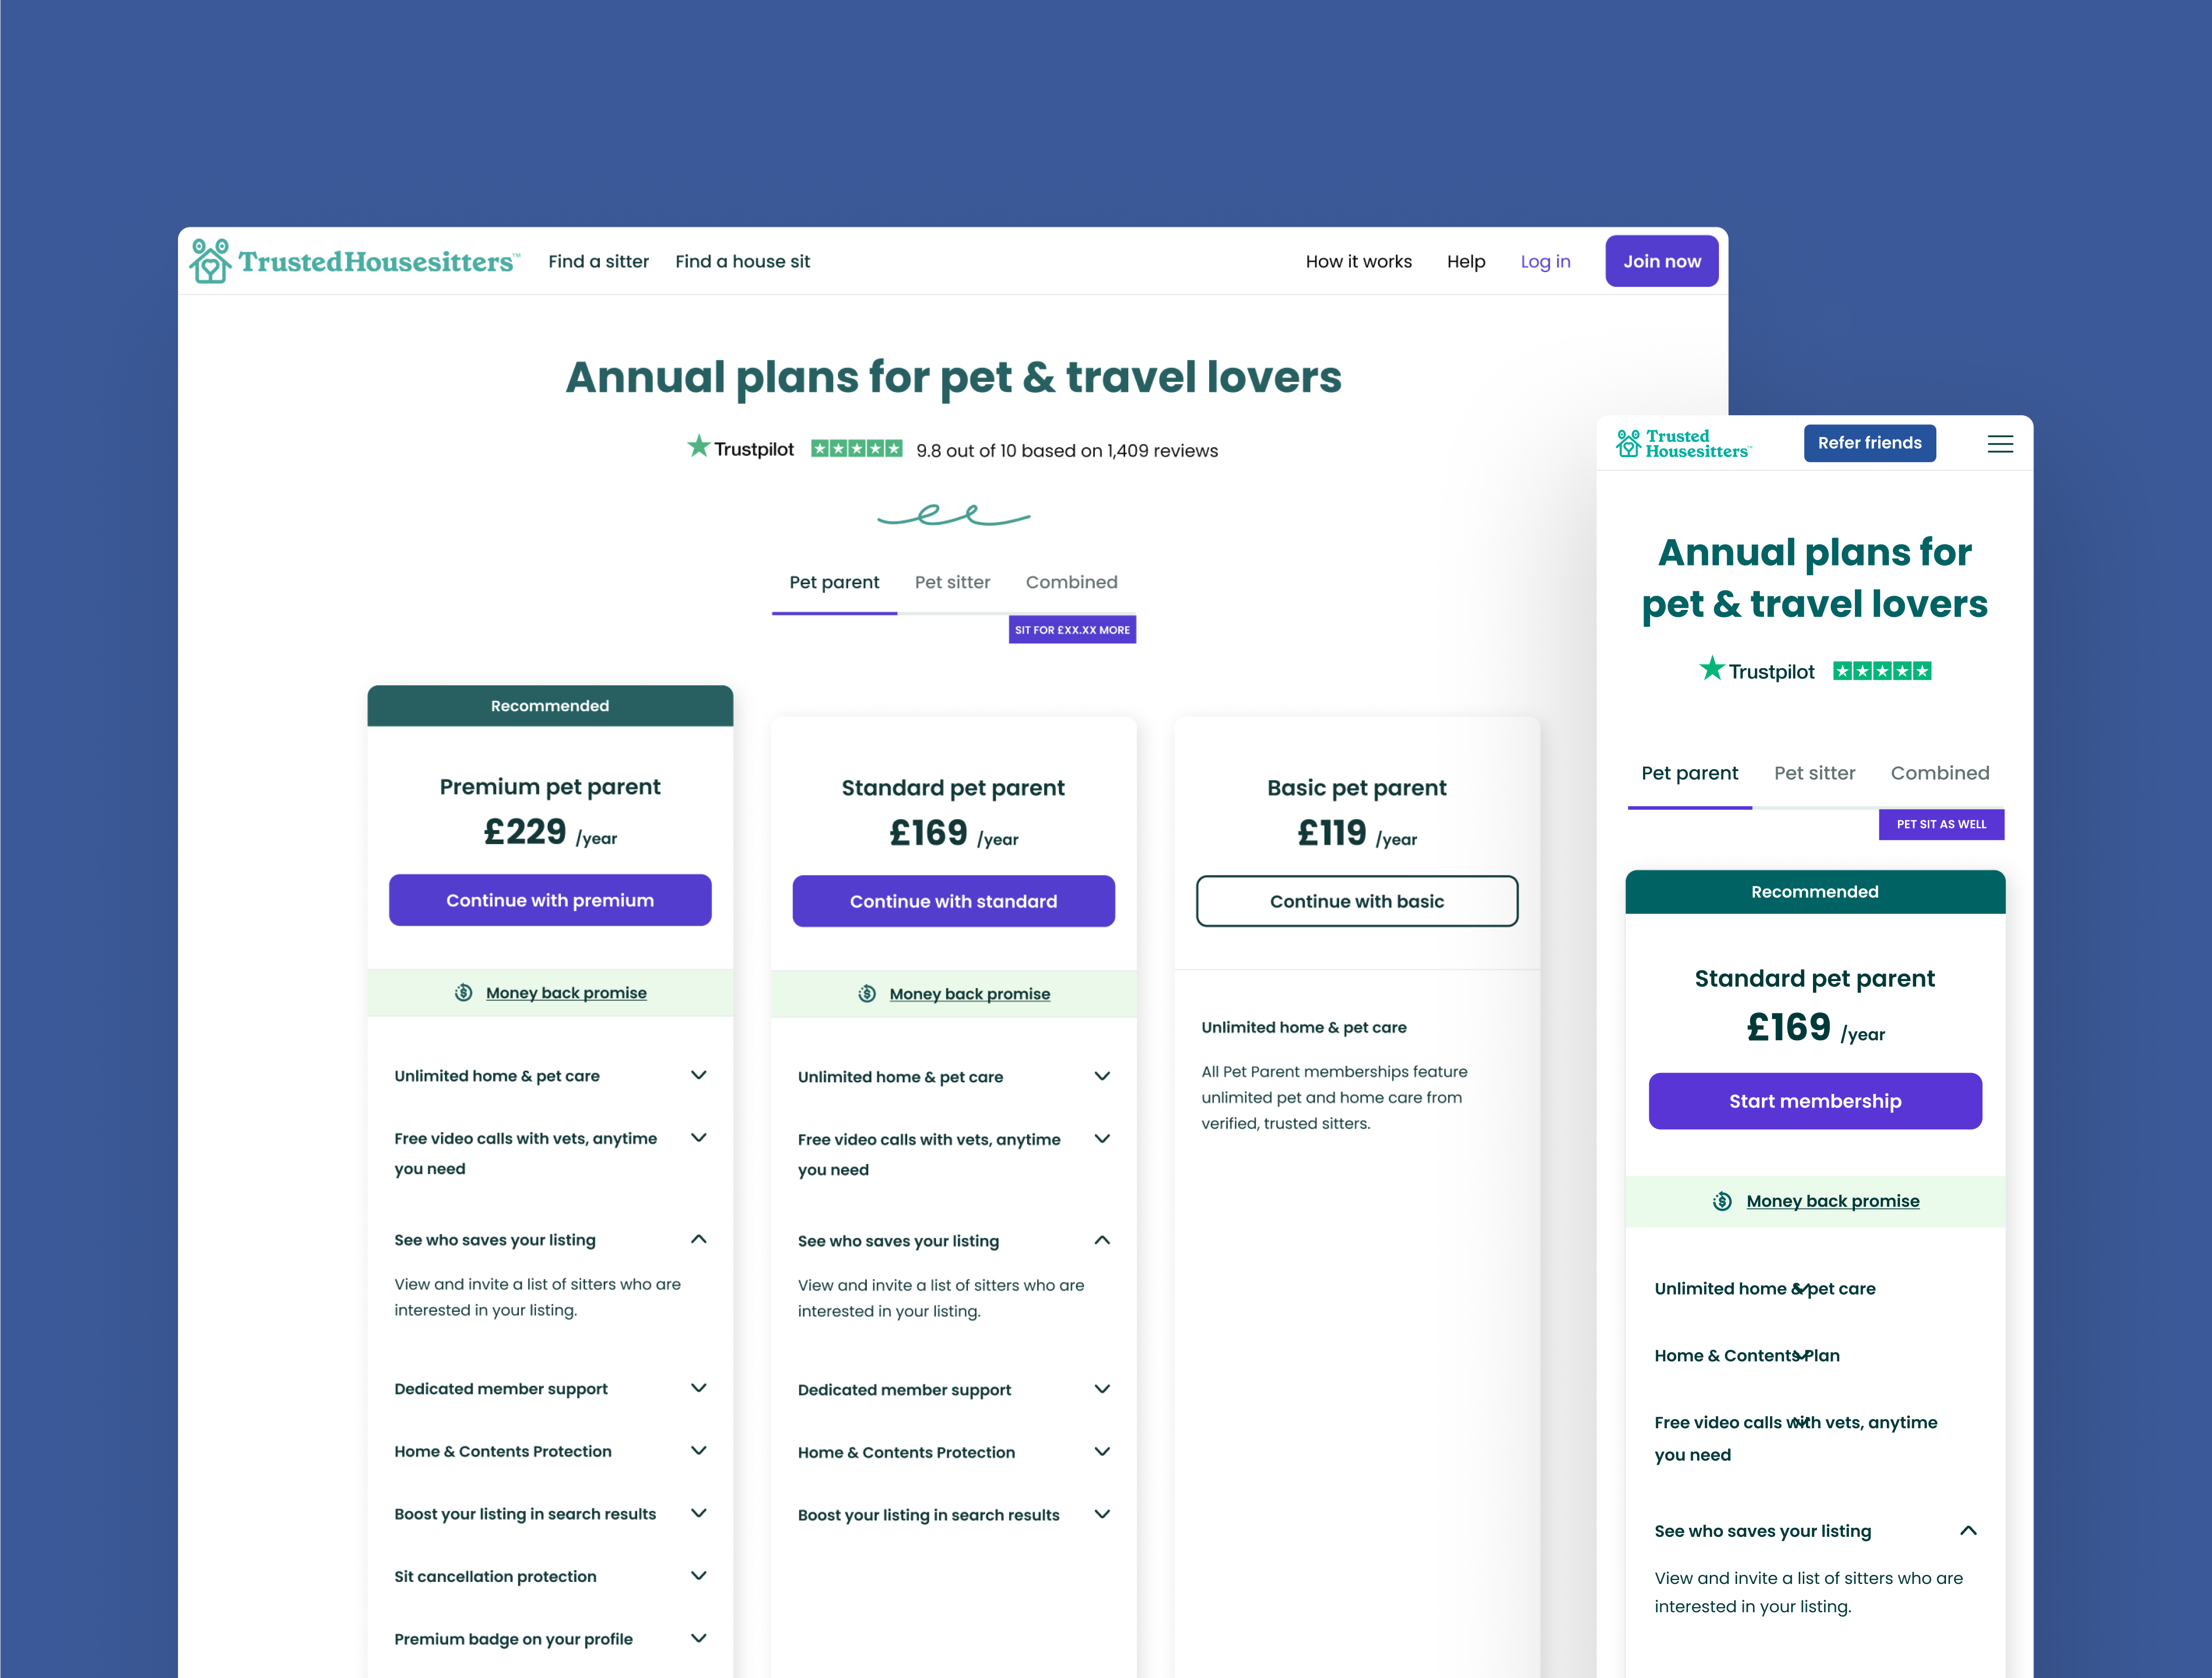
I generated many design concepts based on research findings and best practices. I then created the design for the new pricing page, making several UI improvements such as adding accordions so users could more easily view the features on each tier.
Unmoderated testing
We used usertesting.com to gain feedback on the new page and asses evaluate the overall usability of the page. A key finding was that no users seemed to notice the money back promise, which could be having a negative impact on conversion. The design was therefore adjusted and I broke out the Money Back Promise into its own section to draw emphasis.
A/B testing
We launched an A/B test of the page assessing its impact compared to the old version which ran for four weeks.
Outcome
- Neutral impact on conversion rate
- 19% increase in users clicking to read about a feature, leading to more users choosing premium
- 2% increase in average revenue per user (ARPU) due to more users selecting the premium tier
- Overall positive impact
The test didn’t lead to more users purchasing a plan, but it did have a modest impact on ARPU due to more users selecting the premium tier. Overall this is a highly succesful outcome for a first iteration A/B test and provides a strong platform for the next round of design changes.
An interesting observation was that although I’d attempted to increase the prominence of the Money Back Promise, the data actually showed less people were clicking on it than the previous version. Our hypothesis is that its position in the design reduced its prominence as it was below a primary button. In the next iteration the design will be adjusted to account for this and draw more users to explore the benefit.